
Transportation Map
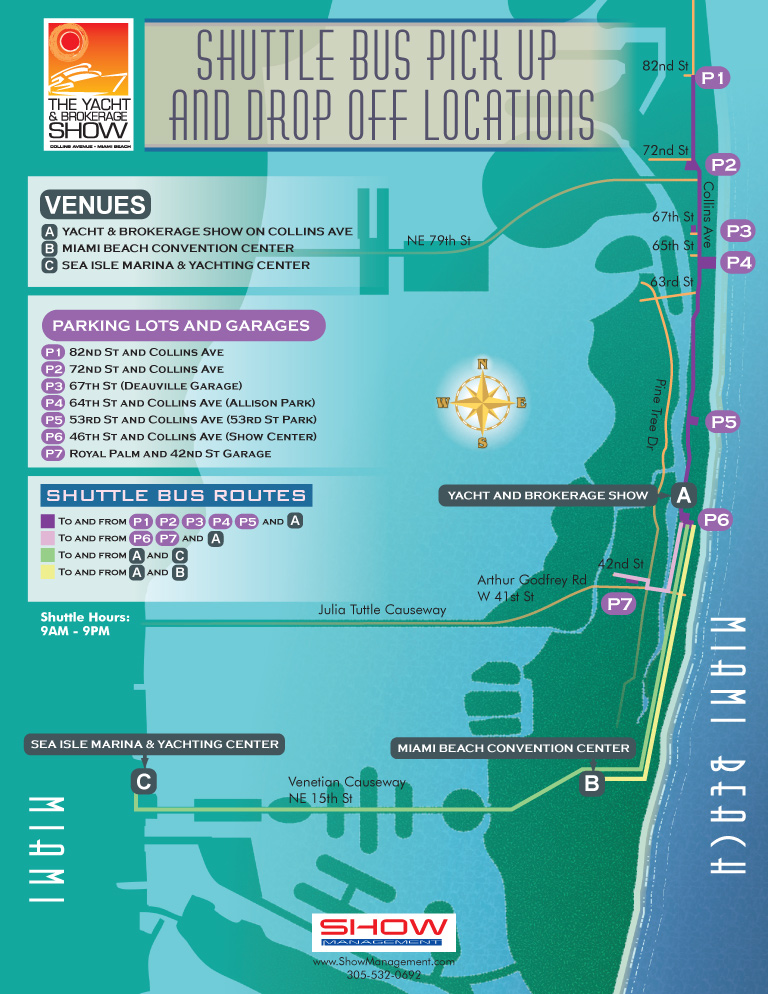
EXAMPLES OF MAPS CREATED FOR MIAMI BOAT SHOWS:


Maps For Boat Shows In Miami:
- About Miami Boat Shows
- Miami International Boat Show / Miami Yacht Show / Yachts Miami Beach / Miami Beach Yacht and Brokerage Show - Show Center/Primary Venue Maps: 2026 | 2025 | 2024 | 2023 | 2022 | 2020 | 2019 | 2018 | 2017 | 2016 | 2015 | 2014 | 2013 | 2012 | 2011
- Transportation Map: 2026 | 2025 | 2024 | 2023 | 2022 | 2020 | 2019 | 2016 | 2013 | 2012
- Program Layout: 2026 | 2025 | 2024 | 2023 | 2022
- Yacht Haven Grande at Island Gardens: 2026 | 2022 | 2020 | 2016
- Miami Beach Convention Center: 2026 | 2025 | 2024 | 2023 | 2022 | 2013 | 2012
- Sea Isle Marina Only: 2013 | 2012
- Miamarina at Bayside Only: 2013 | 2012 | 2011
- Bayfront Park: 2015
- Museum Park Marina: 2025 | 2024 | 2023 | 2022
- Illustration (not a map): 2014
- Video: 2013
Miami International Boat Show Maps 2013:
Miami Beach Convention Center Map | New Yacht & Power Boat Show at Sea Isle MarinaStrictly Sail Miami at Miamarina Bayside | Miami International Boat Show Transit | Miami Beach Convention Center Parking
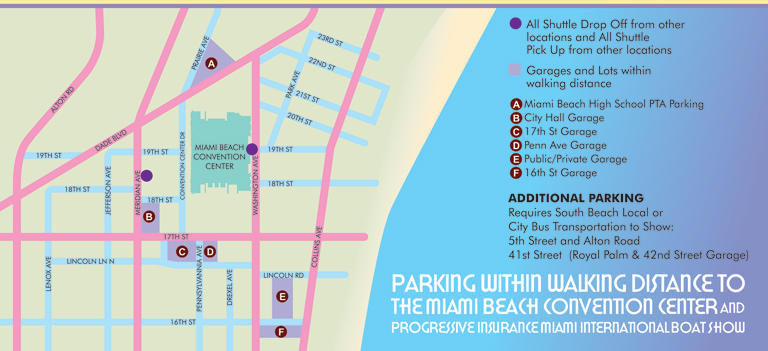
TRANSIT, PARKING AND TRANSPORTATION MAPS:
These maps are often presented from a direct overhead perspective, giving them a familiar appearance similar to the street maps many people use in their cars. Accuracy, clarity, and selective emphasis are essential, as these maps are frequently used in real time, often while navigating busy streets or parking areas. I tailor the level of detail to each client's needs, including only the elements that are most useful for users, ensuring that finding the right location is always intuitive and straightforward.
In many recent projects, I have incorporated geospatial data to produce maps in a more conventional cartographic style. Complex sites with dense street networks, multiple access points, or high volumes of features require reliable external data sources to ensure efficiency and accuracy. Even when using this data, I apply my own illustrative approach to enhance readability, highlight key locations, and maintain a consistent visual identity that aligns with the client's goals.
There are also cases where a three-dimensional perspective is advantageous. A 3D view can provide a more realistic understanding of a site, helping viewers visualize parking areas, transit hubs, and landmarks in context. In locations dominated by prominent features or architectural highlights, this perspective can make orientation easier and offer users a more immersive, intuitive experience than a standard overhead view.
Whether presented in 2D or 3D, these maps are designed to simplify navigation, improve user confidence, and support the operational and marketing goals of transportation, parking, and transit organizations. By combining precision, clarity, and visual appeal, they provide an essential tool for both staff and visitors.


PORTFOLIO SELECTIONS
- Custom illustration & covers: Featuring bespoke illustration, book and magazine covers, hand-drawn maps, and building renderings.
- Fine art & murals: Including one-of-a-kind paintings and drawings, the Custom Halftone Series, and large-scale murals.
- Design & motion media: Covering graphic design, plus video and motion and animated illustration.
- Mapping by application: Tailored maps for marine events, hospitality, waterfront, property, transit, municipal, recreation, and navigation needs.
- Additional creative work: Includes editorial covers, vehicle graphics, concept renderings, and public art.
- Mediums & formats: Ranging from digital vector and isometric projection to traditional paint, line art, GIS-based, aerial-style, and halftone.
- Software expertise: Proficient in Photoshop, Illustrator, SketchUp, InDesign, and Premiere/After Effects for motion. More recently I have worked with AI.