Convention Center Floor Plan Site Map for a Trade Show - 2013
Client: National Marine Manufacturers Association
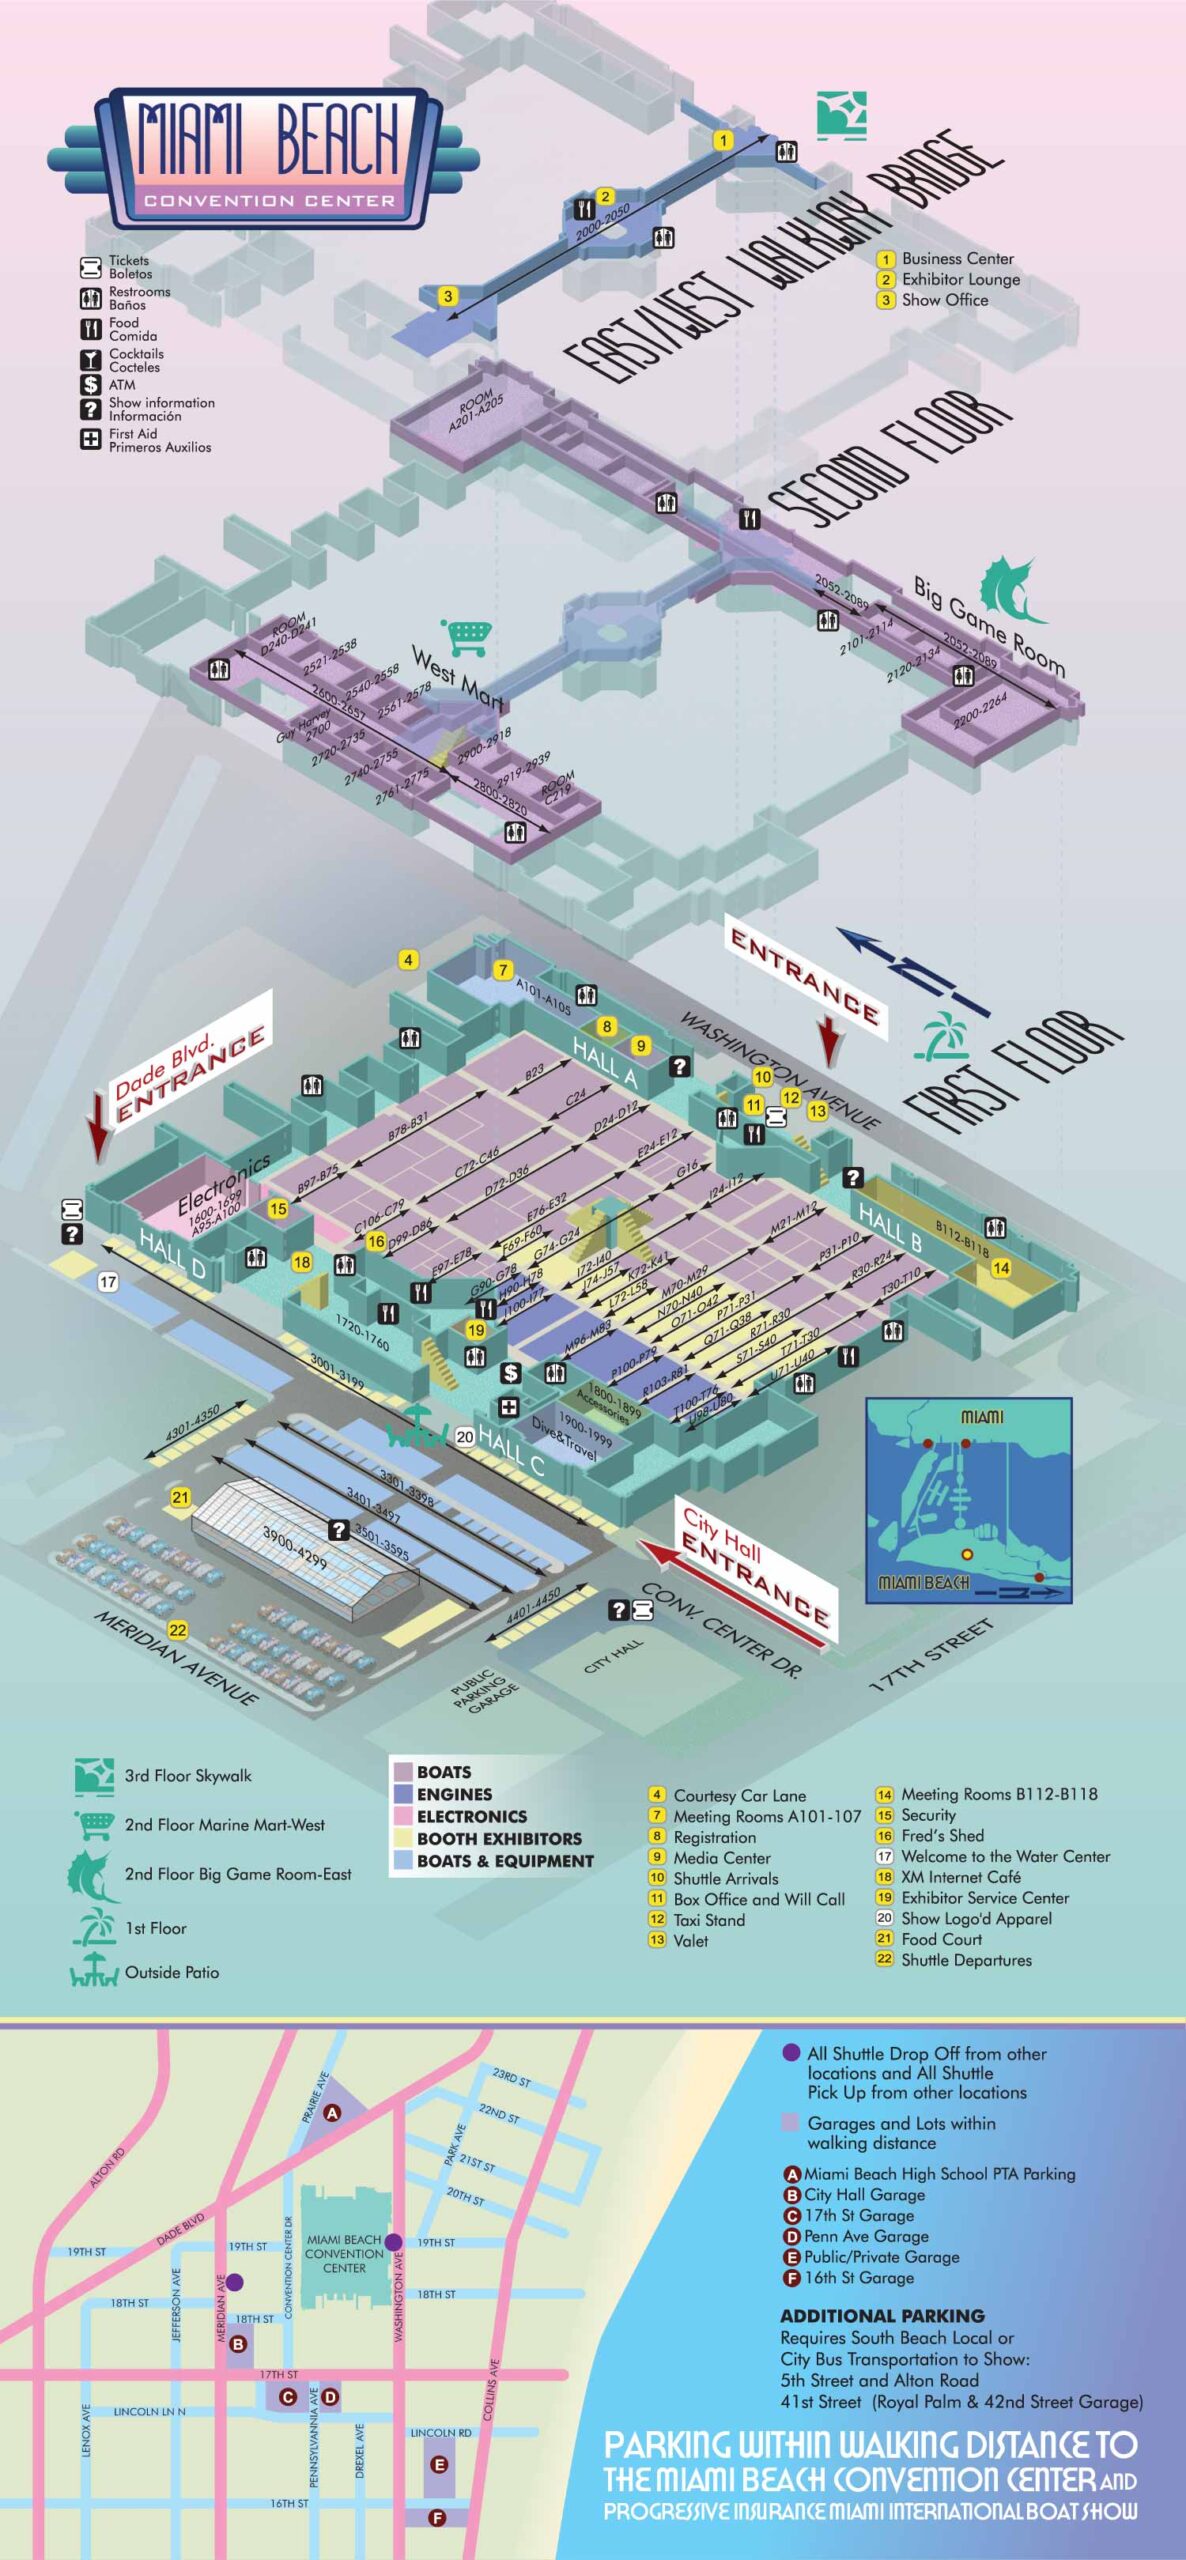
These vector based maps were created to help visitors easily navigate the Miami Beach Convention Center and locate vendors, exhibitors, and essential services across multiple floors. A companion street map provides clear guidance to nearby parking, supporting both event planning and on site wayfinding.
The convention center itself is illustrated using an axonometric drawing approach, which allows all floors to be shown simultaneously while preserving a clear sense of scale and spatial relationships. The artwork is fully vector based and uses a Miami inspired color palette that adds visual warmth while remaining professional and easy to read. The building is presented as three stacked layers, each representing a different floor. Because all layers are perfectly aligned, visitors can quickly understand how spaces relate to one another as they move through the venue.
Key locations within the convention center are identified using a numbered legend, making it easy to match map references with exhibitor listings. Different exhibitor categories are color coded, creating visual zones that echo the look and logic of carpeted show floors. Booth numbers are labeled directly on the map, with larger exhibitor areas shown as numbered spans where appropriate. Recurring amenities such as restrooms and information desks are marked with a simple black and white icon set, while larger destinations and shared spaces are highlighted with more prominent color icons.
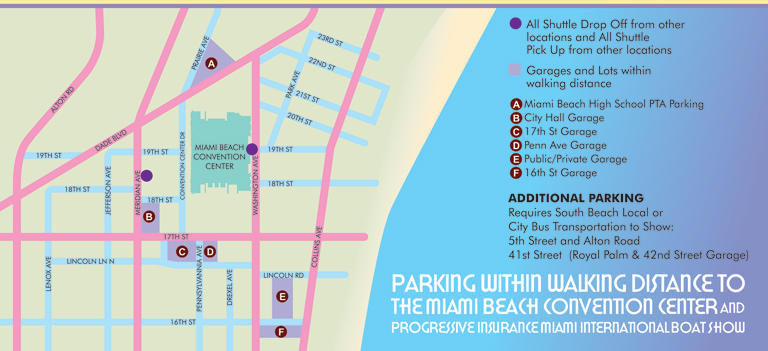
A separate overhead street map is included below the main illustration to show available parking options in the immediate area surrounding the convention center. Together, these maps combine clear organization, accurate scale, and thoughtful visual design to support efficient navigation, improve the visitor experience, and enhance communication for large scale events.
EXAMPLES OF MAPS CREATED FOR MIAMI BOAT SHOWS:


Maps For Boat Shows In Miami:
- About Miami Boat Shows
- Miami International Boat Show / Miami Yacht Show / Yachts Miami Beach / Miami Beach Yacht and Brokerage Show - Show Center/Primary Venue Maps: 2026 | 2025 | 2024 | 2023 | 2022 | 2020 | 2019 | 2018 | 2017 | 2016 | 2015 | 2014 | 2013 | 2012 | 2011
- Transportation Map: 2026 | 2025 | 2024 | 2023 | 2022 | 2020 | 2019 | 2016 | 2013 | 2012
- Program Layout: 2026 | 2025 | 2024 | 2023 | 2022
- Yacht Haven Grande at Island Gardens: 2026 | 2022 | 2020 | 2016
- Miami Beach Convention Center: 2026 | 2025 | 2024 | 2023 | 2022 | 2013 | 2012
- Sea Isle Marina Only: 2013 | 2012
- Miamarina at Bayside Only: 2013 | 2012 | 2011
- Bayfront Park: 2015
- Museum Park Marina: 2025 | 2024 | 2023 | 2022
- Illustration (not a map): 2014
- Video: 2013
Miami International Boat Show Maps 2013:
Miami Beach Convention Center Map | New Yacht & Power Boat Show at Sea Isle MarinaStrictly Sail Miami at Miamarina Bayside | Miami International Boat Show Transit | Miami Beach Convention Center Parking


WHAT ARE AXONOMETRIC AND ISOMETRIC ILLUSTRATIONS?:
Axonometric and isometric drawings don’t have realistic perspective. I use specific mathematical formulas to draw this way. In these images things further away don’t appear smaller and therefore have equal weight of importance to things nearby. My axonometric maps and illustrations are generally bold and have a slightly cartoon like look. This method of rendering perspective is commonly used in technical and engineering drawings. I began using this method of drawing as an illustration tool in 2007.
The difference between isometric and axonometric is isometric drawings are really just from a straight on corner angle but axonometric drawings can be from other angles. Most of my illustrations have parts that are isometric, but are largely axonometric. I have a habit of calling them all isometric, but I shouldn't.
EXPLORE MY WORK
- Illustration: Discover custom illustrations, book covers, illustrated maps, and architectural renderings.
- Fine Art: Browse original paintings and drawings, view the Custom Halftone Series, or check out mural projects.
- Graphic Design & Motion: See the graphic design collection, then dive into motion design and animated illustrations.
- Maps by industry: View illustrated maps tailored for boat shows, resorts, marinas, real estate, transportation, towns, parks, and wayfinding.
- More project types: Explore cover art, vehicle wraps, proposal renderings, and street art.
- Techniques & styles: Work spans vector, isometric, painting, black-and-white, GeoData, overhead maps, and halftones.
- Software expertise: Primary tools include Photoshop, Illustrator, SketchUp Pro, and InDesign, plus Premiere Pro & After Effects for motion.