
Boat Show Illustrated Map
Client: Show Management
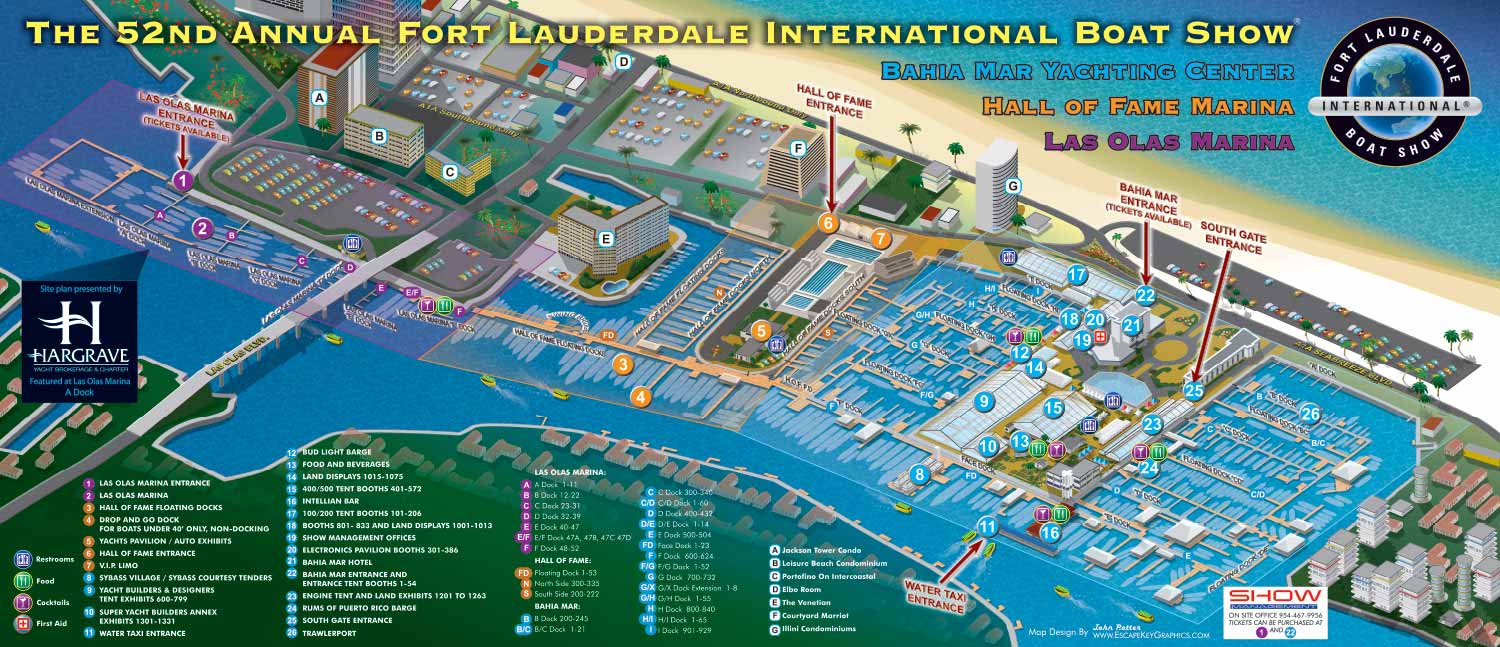
The 2011 Fort Lauderdale International Boat Show map built directly on the foundation established the previous year, carrying forward the overall layout, axonometric perspective, and core visual language introduced in 2010. While the structure of the map remained familiar to returning attendees, the 2011 edition focused on meaningful refinements that improved clarity and organization, particularly in how information was keyed and categorized.
One of the most notable updates was the introduction of keyed, lettered, and color coded markers to identify individual docks. Nearby buildings were also included in the key, providing additional geographic reference for visitors navigating the waterfront. While this level of contextual detail was useful at the time, it was later refined out in subsequent editions to keep attention more tightly focused on the official show footprint.
Points of interest continued to be identified using numbered markers, but in 2011 these markers were color coded to correspond with the specific area of the show in which they were located. This adjustment reinforced the emerging zone based navigation system and helped visitors understand their location more quickly. Amenities and services were represented with icons that featured a subtle three dimensional, high contrast appearance, a visual style that reflected prevailing design trends of the period.
The 2011 map represents an important step in the ongoing evolution of the Fort Lauderdale International Boat Show mapping system. It reflects a year of refinement, experimentation, and growing confidence in the visual strategies that would later be streamlined and optimized for even larger audiences and more complex show layouts.
I an addition to being used as a handout, on the website and on signage this map also appeared in Yachts Magazine.
Fort Lauderdale International Boat Show Maps:
- About Fort Lauderdale International Boat Show
- Bahia Mar, Swimming Hall of Fame & Las Olas Marina Maps: 2025 | 2024 | 2023 | 2022 | 2020 | 2019 | 2018 | 2017 | 2016 | 2015 | 2014 | 2013 | 2012 | 2011 | 2010
- Parking and Transportation Maps: 2026 | 2025 | 2024 | 2023 | 2022 | 2020 | 2019 | 2018 | 2015 Bus | 2015 Water Taxi | 2014 | 2013 | 2012 | 2011
- Broward County Convention Center Maps: 2026 | 2025 | 2024 | 2023 | 2022 | 2017 Sailfish Pavilion | 2017 | 2016 Sailfish Pavilion | 2016 | 2015 Sailfish Pavilion | 2015 | 2014 Sailfish Pavilion | 2014 | 2013 Sailfish Pavilion | 2013 | 2012 | 2011 | 2010
- 17th St Marinas Maps: 2026 | 2025 | 2024 | 2023 | 2022 | 2019 | 2016
- Show Directory Layouts: 2025 | 2024 | 2023 | 2022
- Video: 2013 54th Annual
- Illustrations (not maps): 2014A | 2014B


WHAT ARE AXONOMETRIC AND ISOMETRIC ILLUSTRATIONS?:
Axonometric and isometric drawings don’t have realistic perspective. I use specific mathematical formulas to draw this way. In these images things further away don’t appear smaller and therefore have equal weight of importance to things nearby. My axonometric maps and illustrations are generally bold and have a slightly cartoon like look. This method of rendering perspective is commonly used in technical and engineering drawings. I began using this method of drawing as an illustration tool in 2007.
The difference between isometric and axonometric is isometric drawings are really just from a straight on corner angle but axonometric drawings can be from other angles. Most of my illustrations have parts that are isometric, but are largely axonometric. I have a habit of calling them all isometric, but I shouldn't.
BROWSE MY WORK
- Illustration: Browse custom illustrations, book cover art, illustrated maps, and architectural renderings.
- Fine art: View original paintings and drawings, the Custom Halftone Series, and mural commissions.
- Graphic design & motion: See design projects, then watch motion reels and animated pieces.
- Maps by use case: Explore illustrated maps created for boat shows, resorts, marinas, real estate, transportation & parking, cities & towns, parks, and wayfinding.
- Specialty projects: Also check out cover design, vinyl & vehicle wraps, proposal renderings, and street art.
- Style & technique: Discover vector, isometric, painterly, monochrome, data-driven, bird's-eye, and halftone approaches.
- Tools I use: Everyday software includes Photoshop, Illustrator, SketchUp, and InDesign; motion work relies on Premiere & After Effects. Recently I have begun some work using AI as well.