
2013 Fort Lauderdale International Boat Show Map: A Modern Transformation
Client: Show Management
For information about the Fort Lauderdale International Boat Show visit FLIBS.com
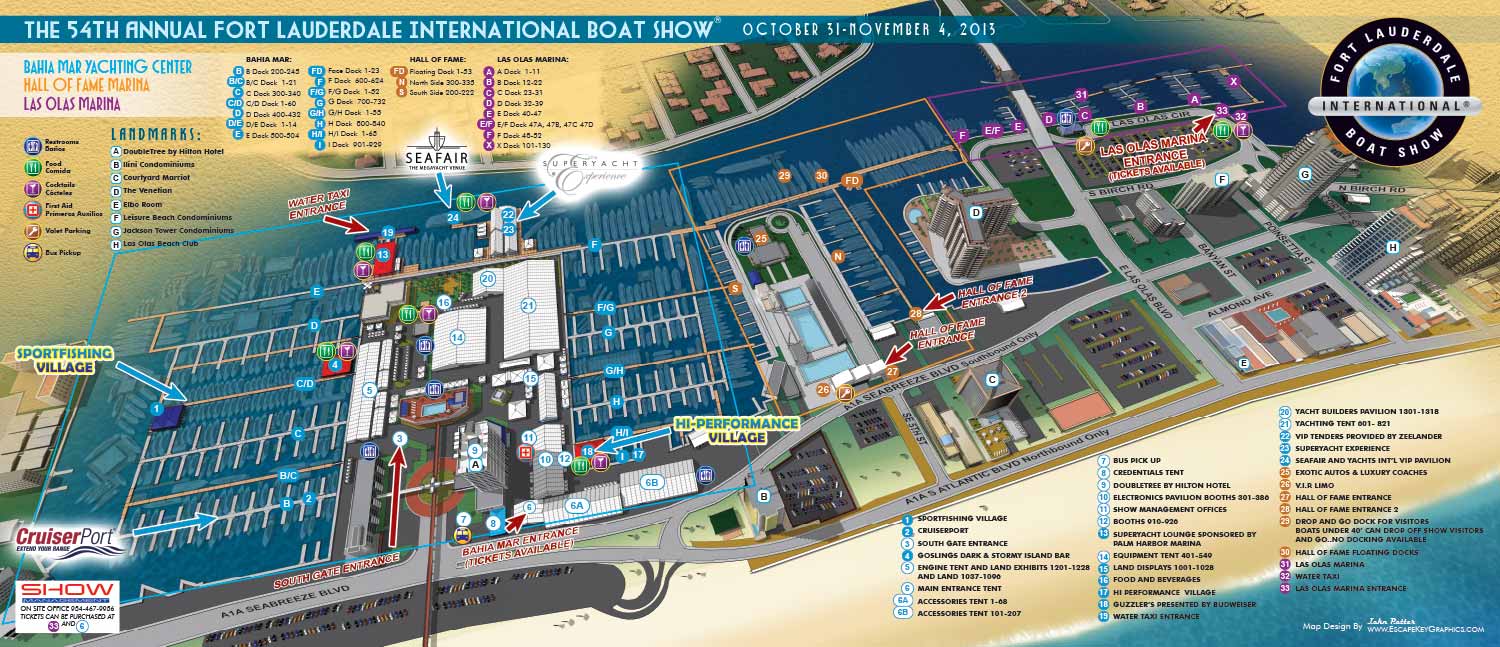
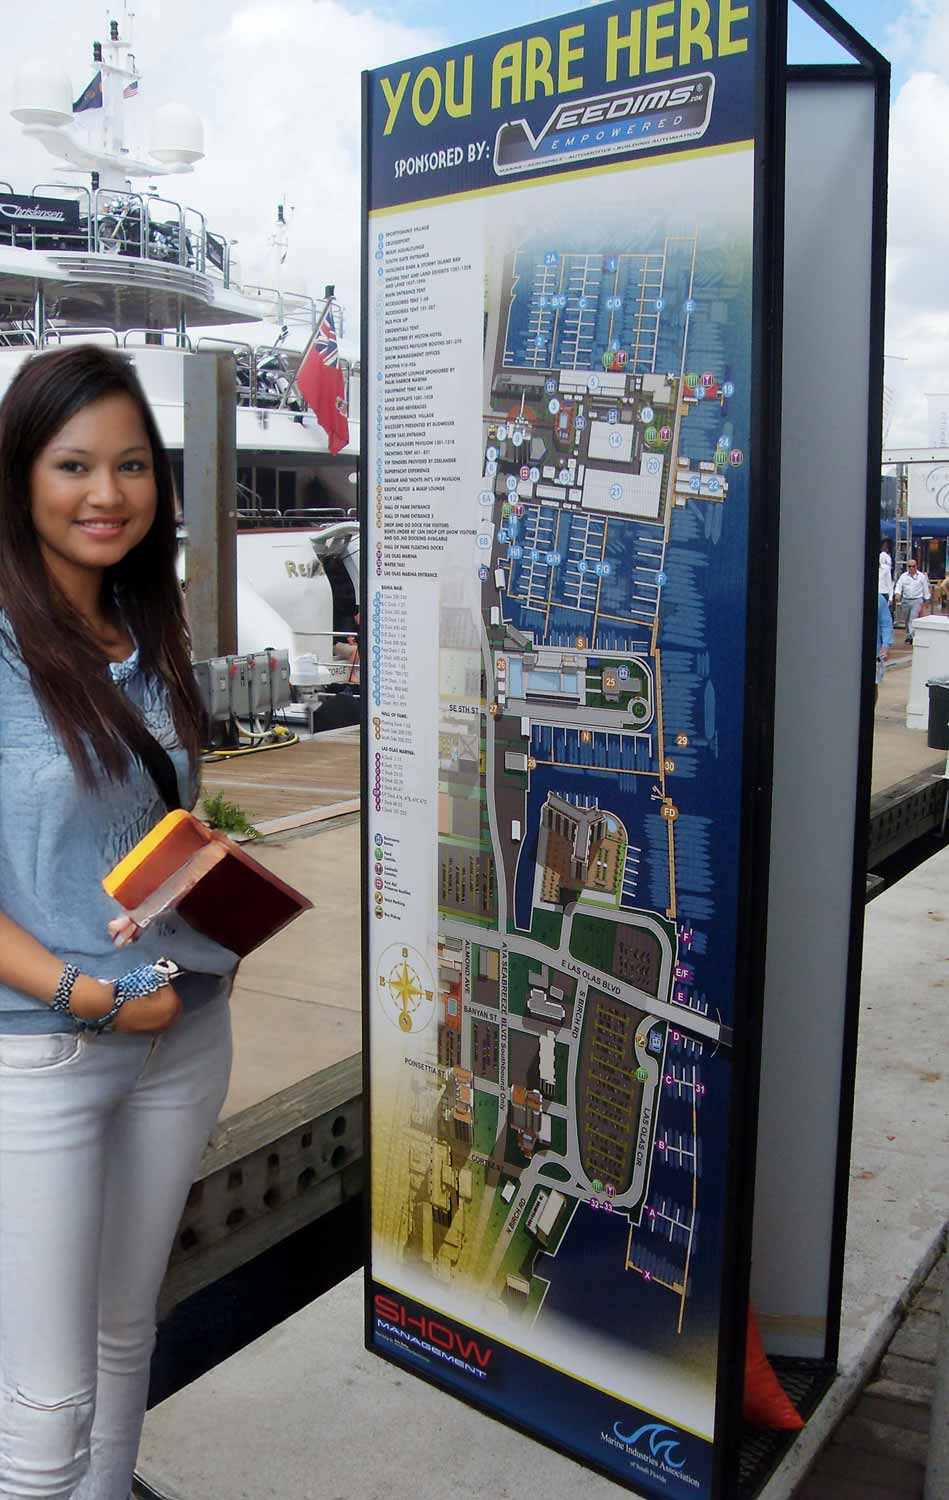
The 2013 Fort Lauderdale International Boat Show (FLIBS) marked a pivotal year in the evolution of its official map. Embracing new technology and design methodology, I undertook a comprehensive redesign to fundamentally improve its accuracy, versatility, and visual presentation.
The most significant advancement was the adoption of SketchUp Pro as a core design tool. This allowed me to rebuild the entire map from the ground up as a detailed three dimensional digital model. The scope was substantial, encompassing the full show footprint from Bahia Mar south through the Swimming Hall of Fame and down to Las Olas Marina. Constructed with a focus on precise scale and placement, this model served as a single, authoritative source of truth for the event's geography.
This new 3D approach offered unprecedented flexibility. The map could now be rendered from any angle or zoom level, allowing for dynamic views that ranged from expansive aerial overviews to focused shots. This versatility ensured the illustration could meet a wide array of promotional and informational needs while maintaining perfect consistency across all views.
Client: Burgess Yachts
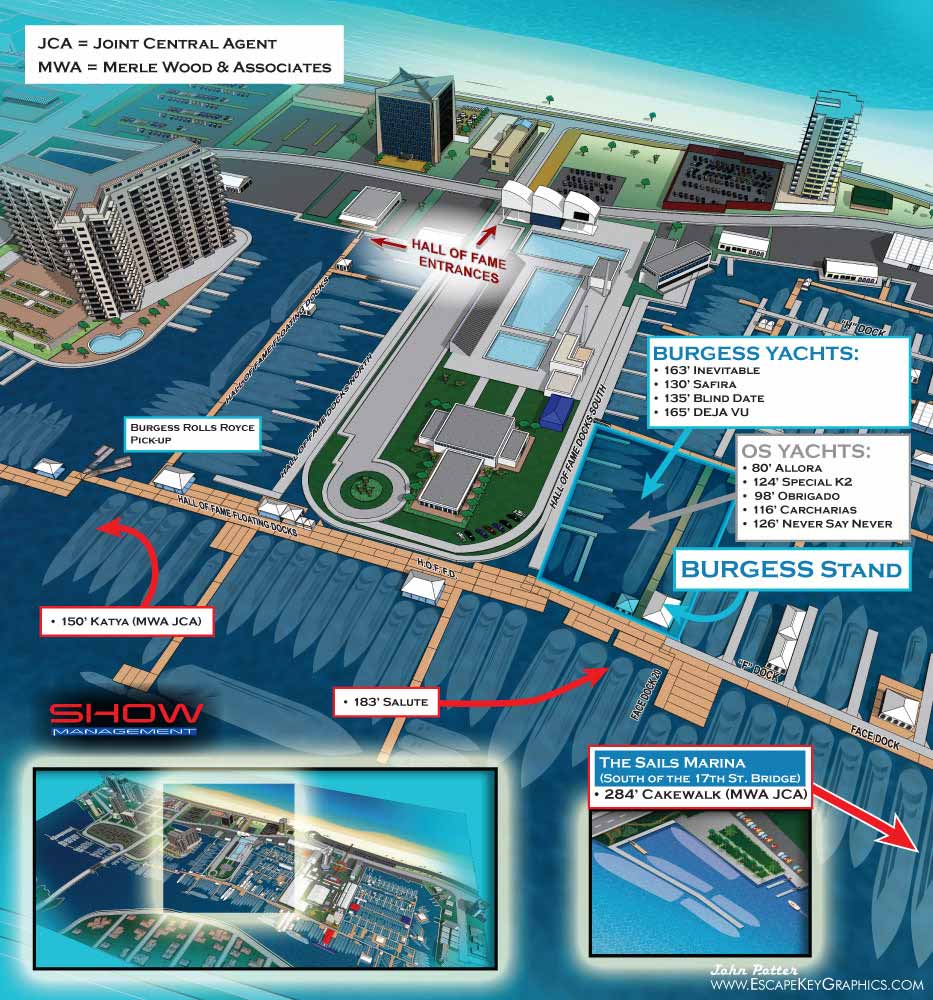
Refining the Visual Language
With the shift to a more realistic 3D environment, I reconsidered how to best represent the hundreds of vessels in the show. Concerned that detailed boat models might be misinterpreted as literal representations of specific yachts, I introduced a stylistic solution. In this 2013 map, the boats are rendered as translucent, ghost like forms, a deliberate choice to indicate their implied, non specific presence.
The navigational keying system saw minor stylistic refinements but maintained its user friendly, color coded logic by area, with amenities clearly indicated by graphical icons. For the surrounding negative space, I introduced a textured sandy background with a subtle dimpled pattern, evoking the coastal setting without distracting from the map's functional clarity.
An Expanded Toolkit and Scope
This project reflected a matured production workflow, now utilizing four specialized software packages in concert, including Adobe Illustrator for final graphic refinement. The scope of work for the 2013 show also expanded beyond the main map. Additional deliverables included a detailed map of the Broward County Convention Center exhibits, a dedicated Transportation Map, supplementary maps for the Hilton Marina and Sails Marina, and a series of directional signs, creating a fully cohesive visual system for the event.
This year represented a major step forward, blending technical precision with thoughtful design to create a more robust and adaptable illustrative tool for one of the marine industry's most important showcases.
This map is part of a continuing series. To see the progression of this work, you can view the maps from the 2012 FLIBS and 2011 FLIBS.
For more examples of complex illustrative cartography and environmental graphics, please visit my full Illustration Portfolio.
Fort Lauderdale International Boat Show Maps:
- About Fort Lauderdale International Boat Show
- Bahia Mar, Swimming Hall of Fame & Las Olas Marina Maps: 2025 | 2024 | 2023 | 2022 | 2020 | 2019 | 2018 | 2017 | 2016 | 2015 | 2014 | 2013 | 2012 | 2011 | 2010
- Parking and Transportation Maps: 2026 | 2025 | 2024 | 2023 | 2022 | 2020 | 2019 | 2018 | 2015 Bus | 2015 Water Taxi | 2014 | 2013 | 2012 | 2011
- Broward County Convention Center Maps: 2026 | 2025 | 2024 | 2023 | 2022 | 2017 Sailfish Pavilion | 2017 | 2016 Sailfish Pavilion | 2016 | 2015 Sailfish Pavilion | 2015 | 2014 Sailfish Pavilion | 2014 | 2013 Sailfish Pavilion | 2013 | 2012 | 2011 | 2010
- 17th St Marinas Maps: 2026 | 2025 | 2024 | 2023 | 2022 | 2019 | 2016
- Show Directory Layouts: 2025 | 2024 | 2023 | 2022
- Video: 2013 54th Annual
- Illustrations (not maps): 2014A | 2014B
Fort Lauderdale International Boat Show Map Video
2013 54th Annual


PORTFOLIO SELECTIONS
- Custom illustration & covers: Featuring bespoke illustration, book and magazine covers, hand-drawn maps, and building renderings.
- Fine art & murals: Including one-of-a-kind paintings and drawings, the Custom Halftone Series, and large-scale murals.
- Design & motion media: Covering graphic design, plus video and motion and animated illustration.
- Mapping by application: Tailored maps for marine events, hospitality, waterfront, property, transit, municipal, recreation, and navigation needs.
- Additional creative work: Includes editorial covers, vehicle graphics, concept renderings, and public art.
- Mediums & formats: Ranging from digital vector and isometric projection to traditional paint, line art, GIS-based, aerial-style, and halftone.
- Software expertise: Proficient in Photoshop, Illustrator, SketchUp, InDesign, and Premiere/After Effects for motion. More recently I have worked with AI.