Illustrated Map of a Marina Showing Pier and Dock Locations as well as Facilities Locations - 2013
Client: National Marine Manufacturers Association
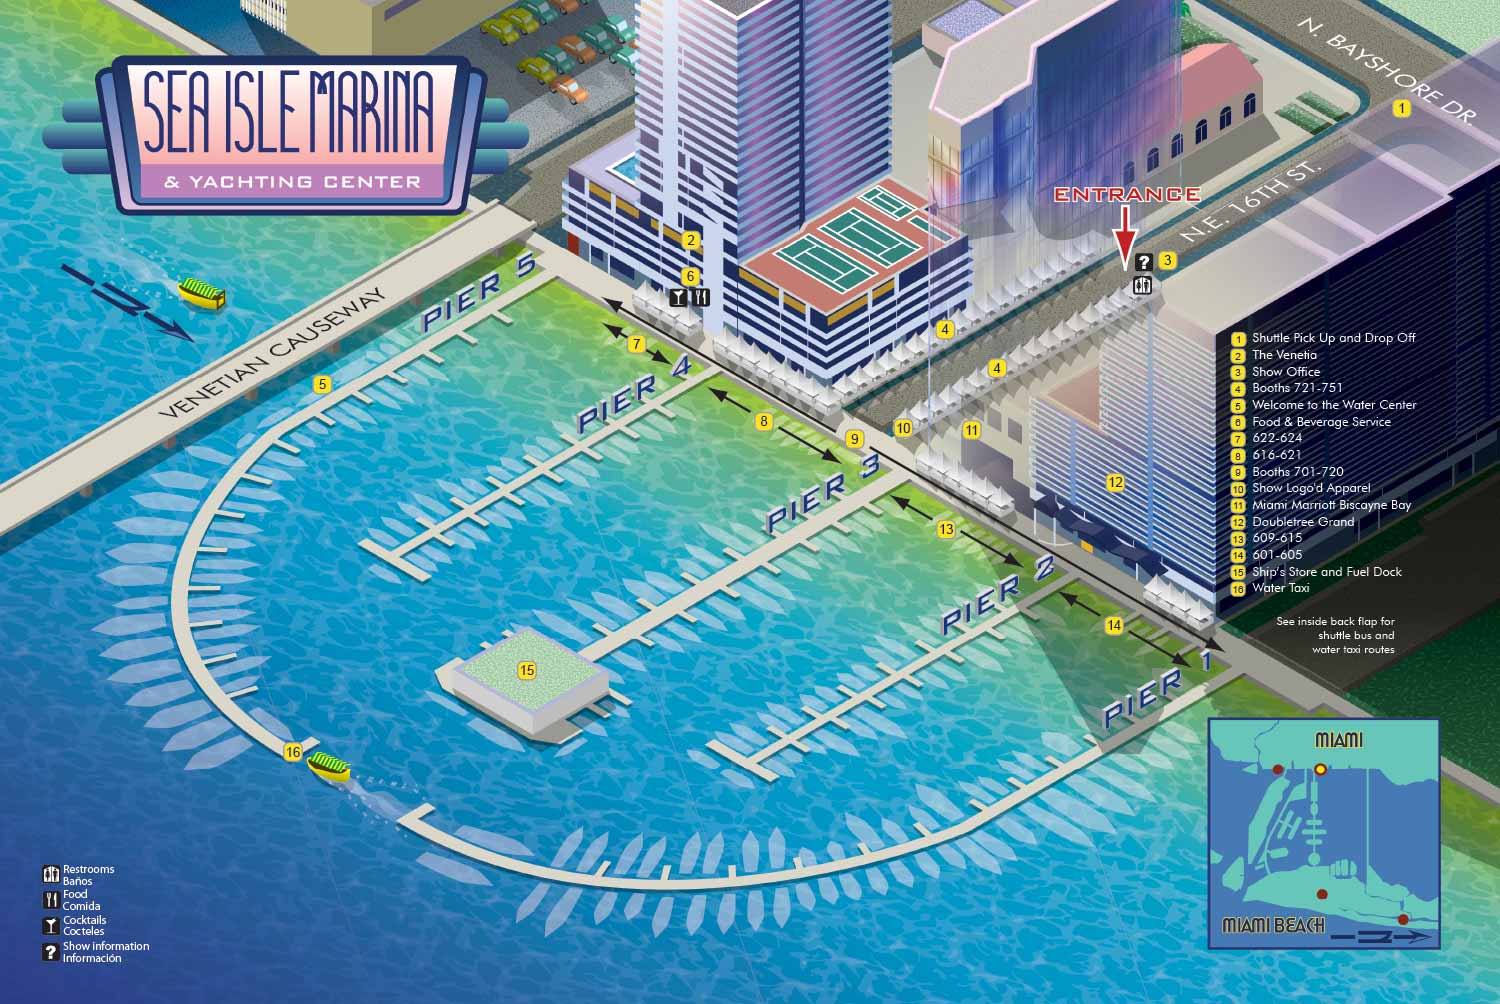
This illustrated map was created for the 2013 New Yacht and Powerboat Show and features Sea Isle Marina, located at 1635 North Bayshore Drive at the mainland end of the Venetian Causeway in Miami. The project was designed to support event navigation while also capturing the distinctive character of the waterfront venue. Sea Isle Marina’s central location made it an important point of access.
The illustration was produced entirely in vector format using an axonometric drawing approach, which allowed the map to present depth and structure without relying on traditional perspective. A bold, Miami inspired color palette was chosen to reflect the energy of the location and the event itself.
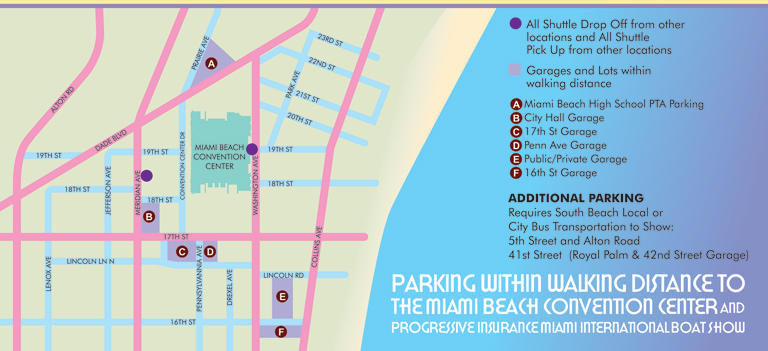
Wayfinding elements were carefully integrated throughout the map. Key locations were identified with numbered yellow markers, docks were labeled directly within the illustration as three dimensional axonometric forms, and street names were placed in a manner that suggests they are painted onto the roadway. Recurring amenities were represented with icons for easy recognition. An inset map provided additional context by showing how Sea Isle Marina related to other show venues. This project reflects an early period in which Art Deco influences played a strong role in the visual style, contributing to a vibrant and memorable event map.
Which Miami Boat Show is this?:
Here is all you need to know... I have been making maps for boat shows in Miami since 2011 and in that time a lot has changed. There have been multiple simultaneous shows, show names have changed and now shows have merged. The assorted show titles used have been Miami International Boat Show, Miami Yacht Show, Yachts Miami Beach, Miami Beach Yacht and Brokerage Show and this doesn't include subsections of the shows like Sea Isle Marina, Museum Park Marina and Strictly Sail Miami at Miamarina Bayside. These shows have been managed by different, sometimes competing, management companies. At some point I have been commissioned to make maps for all of them. I'm not going to try to sort this into a comprehensible timeline or anything like that.
I've endeavored to make the maps easy to find but you may find some hidden gems on my site if you dig. Please enjoy these maps for what they are without getting too distracted by the sequence or sponsors/management companies etc.
EXAMPLES OF MAPS CREATED FOR MIAMI BOAT SHOWS:


Maps For Boat Shows In Miami:
- About Miami Boat Shows
- Miami International Boat Show / Miami Yacht Show / Yachts Miami Beach / Miami Beach Yacht and Brokerage Show - Show Center/Primary Venue Maps: 2026 | 2025 | 2024 | 2023 | 2022 | 2020 | 2019 | 2018 | 2017 | 2016 | 2015 | 2014 | 2013 | 2012 | 2011
- Transportation Map: 2026 | 2025 | 2024 | 2023 | 2022 | 2020 | 2019 | 2016 | 2013 | 2012
- Program Layout: 2026 | 2025 | 2024 | 2023 | 2022
- Yacht Haven Grande at Island Gardens: 2026 | 2022 | 2020 | 2016
- Miami Beach Convention Center: 2026 | 2025 | 2024 | 2023 | 2022 | 2013 | 2012
- Sea Isle Marina Only: 2013 | 2012
- Miamarina at Bayside Only: 2013 | 2012 | 2011
- Bayfront Park: 2015
- Museum Park Marina: 2025 | 2024 | 2023 | 2022
- Illustration (not a map): 2014
- Video: 2013
Miami International Boat Show Maps 2013:
Miami Beach Convention Center Map | New Yacht & Power Boat Show at Sea Isle MarinaStrictly Sail Miami at Miamarina Bayside | Miami International Boat Show Transit | Miami Beach Convention Center Parking


WHAT ARE AXONOMETRIC AND ISOMETRIC ILLUSTRATIONS?:
Axonometric and isometric drawings don’t have realistic perspective. I use specific mathematical formulas to draw this way. In these images things further away don’t appear smaller and therefore have equal weight of importance to things nearby. My axonometric maps and illustrations are generally bold and have a slightly cartoon like look. This method of rendering perspective is commonly used in technical and engineering drawings. I began using this method of drawing as an illustration tool in 2007.
The difference between isometric and axonometric is isometric drawings are really just from a straight on corner angle but axonometric drawings can be from other angles. Most of my illustrations have parts that are isometric, but are largely axonometric. I have a habit of calling them all isometric, but I shouldn't.
PORTFOLIO SELECTIONS
- Custom illustration & covers: Featuring bespoke illustration, book and magazine covers, hand-drawn maps, and building renderings.
- Fine art & murals: Including one-of-a-kind paintings and drawings, the Custom Halftone Series, and large-scale murals.
- Design & motion media: Covering graphic design, plus video and motion and animated illustration.
- Mapping by application: Tailored maps for marine events, hospitality, waterfront, property, transit, municipal, recreation, and navigation needs.
- Additional creative work: Includes editorial covers, vehicle graphics, concept renderings, and public art.
- Mediums & formats: Ranging from digital vector and isometric projection to traditional paint, line art, GIS-based, aerial-style, and halftone.
- Software expertise: Proficient in Photoshop, Illustrator, SketchUp, InDesign, and Premiere/After Effects for motion.