Illustrated Race Track and Facilities Map
Client: Dover International Speedway
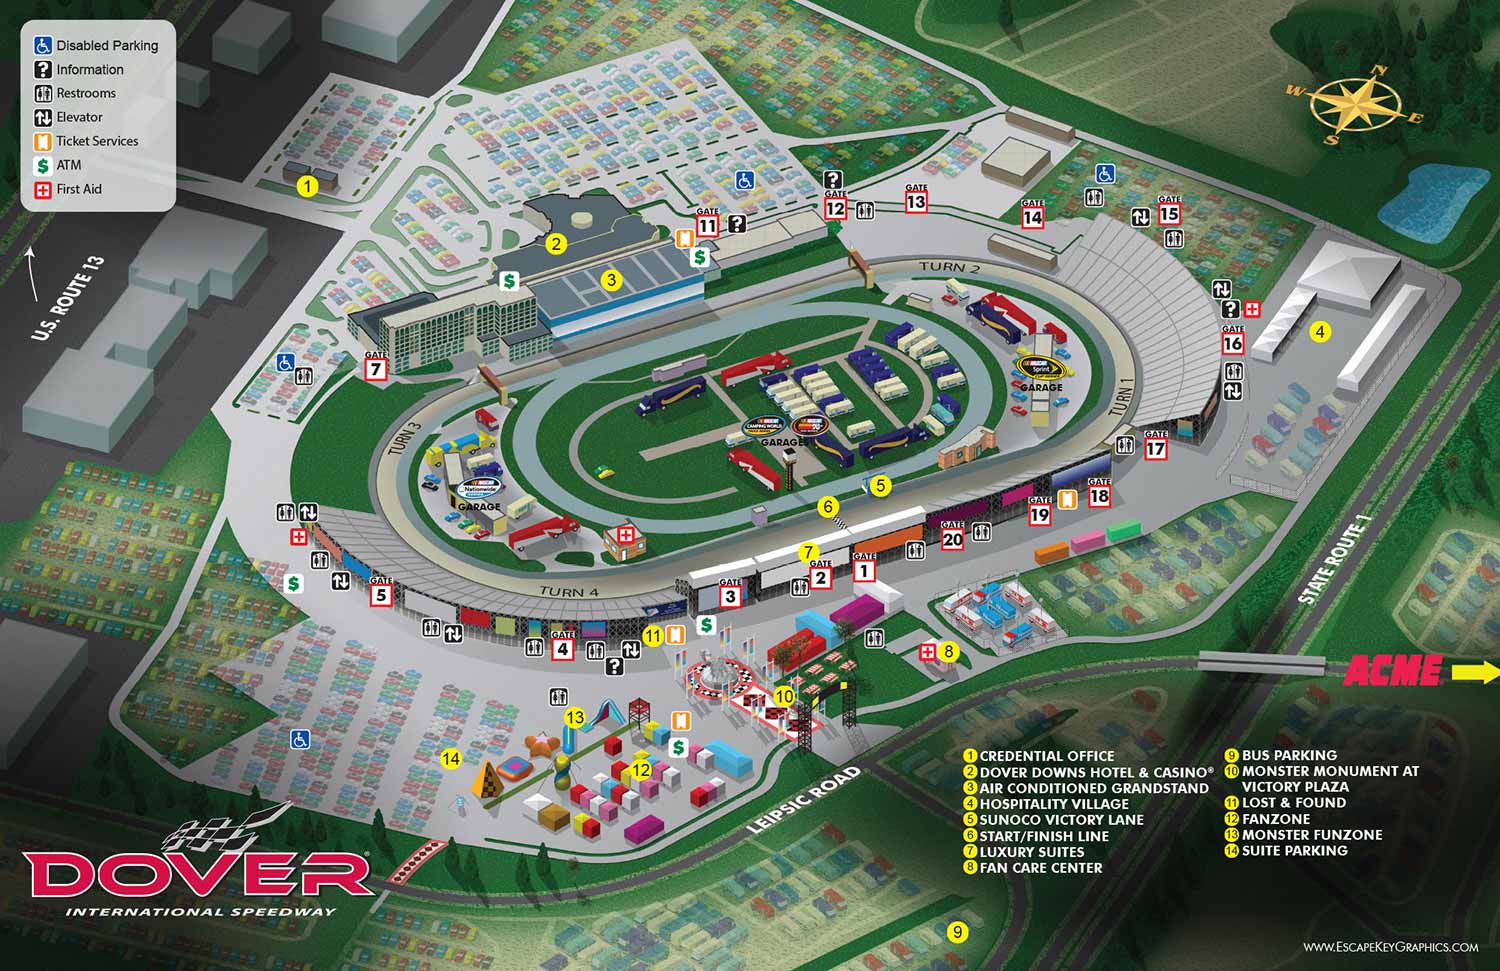
I was commissioned by Dover International Speedway to illustrate and design a comprehensive venue map that serves as a clear and reliable wayfinding tool for visitors. The map was created for both digital and print use and presents the entire facility in an isometric view that helps guests understand the scale and layout of the speedway at a glance. The illustration is fully vector based and was produced in Adobe Illustrator, allowing for precision, flexibility, and long term usability.
Parking was a major priority for this project, as it is critical to the overall visitor experience at a large motorsports venue. At the client’s request, I illustrated cars and RVs throughout the parking areas so guests could easily recognize where different types of vehicles are accommodated. Managing this level of detail required a carefully organized workflow, with multiple layered files used to maintain performance and accuracy. The steeply sloped geometry of the grandstands also presented an interesting technical challenge, for which I had to innovate a solution since I found technical reference for that problem pretty scarce.
Navigation elements were designed to remain intuitive despite the visual complexity of the site. The gates were numbered in little red bordered white boxes and the primary points of interest were keyed by numbers on yellow circles or dots. Recurring amenities such as restrooms and elevators are shown with simple icons so they only need to be explained once. This system keeps the map easy to follow and helps visitors find what they need quickly, even during busy race days.
RACING RELATED ILLUSTRATION:


WHAT ARE AXONOMETRIC AND ISOMETRIC ILLUSTRATIONS?:
Axonometric and isometric drawings don’t have realistic perspective. I use specific mathematical formulas to draw this way. In these images things further away don’t appear smaller and therefore have equal weight of importance to things nearby. My axonometric maps and illustrations are generally bold and have a slightly cartoon like look. This method of rendering perspective is commonly used in technical and engineering drawings. I began using this method of drawing as an illustration tool in 2007.
The difference between isometric and axonometric is isometric drawings are really just from a straight on corner angle but axonometric drawings can be from other angles. Most of my illustrations have parts that are isometric, but are largely axonometric. I have a habit of calling them all isometric, but I shouldn't.
BROWSE MY WORK
- Illustration: Browse custom illustrations, book cover art, illustrated maps, and architectural renderings.
- Fine art: View original paintings and drawings, the Custom Halftone Series, and mural commissions.
- Graphic design & motion: See design projects, then watch motion reels and animated pieces.
- Maps by use case: Explore illustrated maps created for boat shows, resorts, marinas, real estate, transportation & parking, cities & towns, parks, and wayfinding.
- Specialty projects: Also check out cover design, vinyl & vehicle wraps, proposal renderings, and street art.
- Style & technique: Discover vector, isometric, painterly, monochrome, data-driven, bird's-eye, and halftone approaches.
- Tools I use: Everyday software includes Photoshop, Illustrator, SketchUp, and InDesign; motion work relies on Premiere & After Effects.