Marinas Illustrated Map: A Unified View for the 2016 Fort Lauderdale International Boat Show
Client: Show Management
Map for the Fort Lauderdale International Boat Show 2016
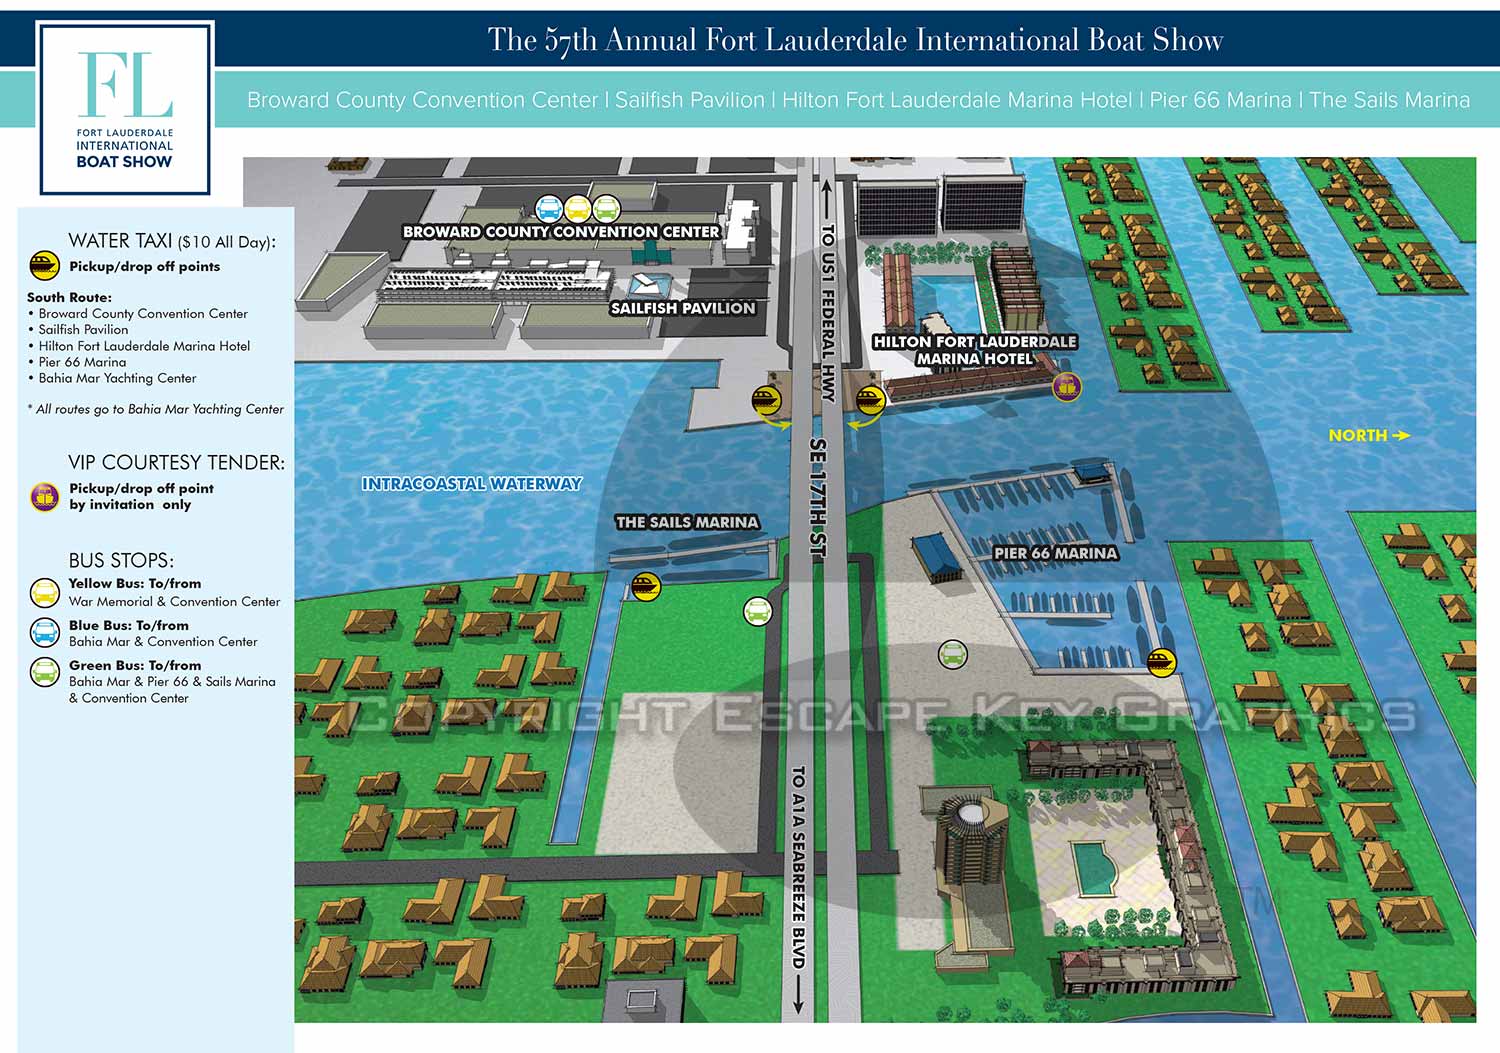
This illustrated map, created for the 2016 Fort Lauderdale International Boat Show (FLIBS), presents a unified overview of the show's key venues along the famous 17th Street Causeway. Prior to this year, maps for the individual marinas were only separate, vector based axonometric illustrations. This project represented a strategic shift, combining these elements into a single, cohesive three dimensional view to clearly show their relative positions and geographic relationships, effectively serving as a detailed supplement to the main transportation map.
Constructed as a dedicated digital model in SketchUp Pro, this illustration was designed for clarity and context. While it includes recognizable representations of the Pier 66 Marina, Sails Marina, Hilton Fort Lauderdale Marina, the Convention Center, and the Sailfish Pavilion, it is important to note this is a separate model from the highly detailed ones used for individual venue maps. To ensure smooth computer performance and maintain a clean, readable overview, this consolidated model utilizes a simplified level of detail, focusing on spatial relationships over intricate architectural rendering.
The map employs a practical keying system to aid navigation. All points of interest are identified using a set of intuitive graphical icons. Furthermore, specific bus stops are color coded, directly linking the physical layout shown on the map to the show's transportation network. This integration helps attendees visualize how the sprawling, multi venue event connects, making it easier to plan their route between the convention center exhibits and the various in water marina displays.
This project demonstrates the value of tailored illustration for different informational purposes. By creating a purpose built, simplified model, this map successfully provides the "big picture" context that was missing from the separate, detailed venue maps, enhancing the overall attendee experience for one of the world's largest boat shows.
This map provided a strategic overview of multiple venues. To see examples of the detailed, individual marina maps, please explore other projects within my Maps Portfolio.
Fort Lauderdale International Boat Show Maps:
- About Fort Lauderdale International Boat Show
- Bahia Mar, Swimming Hall of Fame & Las Olas Marina Maps: 2025 | 2024 | 2023 | 2022 | 2020 | 2019 | 2018 | 2017 | 2016 | 2015 | 2014 | 2013 | 2012 | 2011 | 2010
- Parking and Transportation Maps: 2025 | 2024 | 2023 | 2022 | 2020 | 2019 | 2018 | 2015 Bus | 2015 Water Taxi | 2014 | 2013 | 2012 | 2011
- Broward County Convention Center Maps: 2025 | 2024 | 2023 | 2022 | 2017 Sailfish Pavilion | 2017 | 2016 Sailfish Pavilion | 2016 | 2015 Sailfish Pavilion | 2015 | 2014 Sailfish Pavilion | 2014 | 2013 Sailfish Pavilion | 2013 | 2012 | 2011 | 2010
- Marinas Maps: 2025 | 2024 | 2023 | 2022 | 2019 | 2016
- Program Layouts: 2025 | 2024 | 2023 | 2022
- Signs: 2013 looking north | 2013 Yachting Tent
- Video: 2013 54th Annual
- Illustrations (not maps): 2014A | 2014B


TRANSIT, PARKING AND TRANSPORTATION MAPS:
These maps are often presented from a direct overhead perspective, giving them a familiar appearance similar to the street maps many people use in their cars. Accuracy, clarity, and selective emphasis are essential, as these maps are frequently used in real time, often while navigating busy streets or parking areas. I tailor the level of detail to each client's needs, including only the elements that are most useful for users, ensuring that finding the right location is always intuitive and straightforward.
In many recent projects, I have incorporated geospatial data to produce maps in a more conventional cartographic style. Complex sites with dense street networks, multiple access points, or high volumes of features require reliable external data sources to ensure efficiency and accuracy. Even when using this data, I apply my own illustrative approach to enhance readability, highlight key locations, and maintain a consistent visual identity that aligns with the client's goals.
There are also cases where a three-dimensional perspective is advantageous. A 3D view can provide a more realistic understanding of a site, helping viewers visualize parking areas, transit hubs, and landmarks in context. In locations dominated by prominent features or architectural highlights, this perspective can make orientation easier and offer users a more immersive, intuitive experience than a standard overhead view.
Whether presented in 2D or 3D, these maps are designed to simplify navigation, improve user confidence, and support the operational and marketing goals of transportation, parking, and transit organizations. By combining precision, clarity, and visual appeal, they provide an essential tool for both staff and visitors.
PORTFOLIOS
- Illustration Portfolio: Start here for custom illustration and book covers. You can also browse illustrated maps and architectural rendering.
- Fine Art: I offer original paintings and drawings, including my Custom Halftone Series. You will also find mural work here.
- Graphic Design & Motion: View my graphic design portfolio. After that, explore motion design and animated illustrations.
- Maps by application: I create illustrated maps for boat shows, resorts, marinas, real estate, transportation, transit and parking, towns and cities, parks, and wayfinding.
- Additional project types: I also produce cover illustration, vehicle and vinyl wraps, proposal renderings, and street art.
- Illustration methods: My techniques include vector, isometric and axonometric, painting, black and white, GeoData maps, overhead maps, and custom halftones.
- Software portfolios: I work primarily in Adobe Photoshop, Adobe Illustrator, SketchUp Pro, and Adobe InDesign. For motion projects, I use Premiere Pro and After Effects.