Fort Lauderdale Convention Center 2013 Map: A Digital Transformation
Client: Show Management
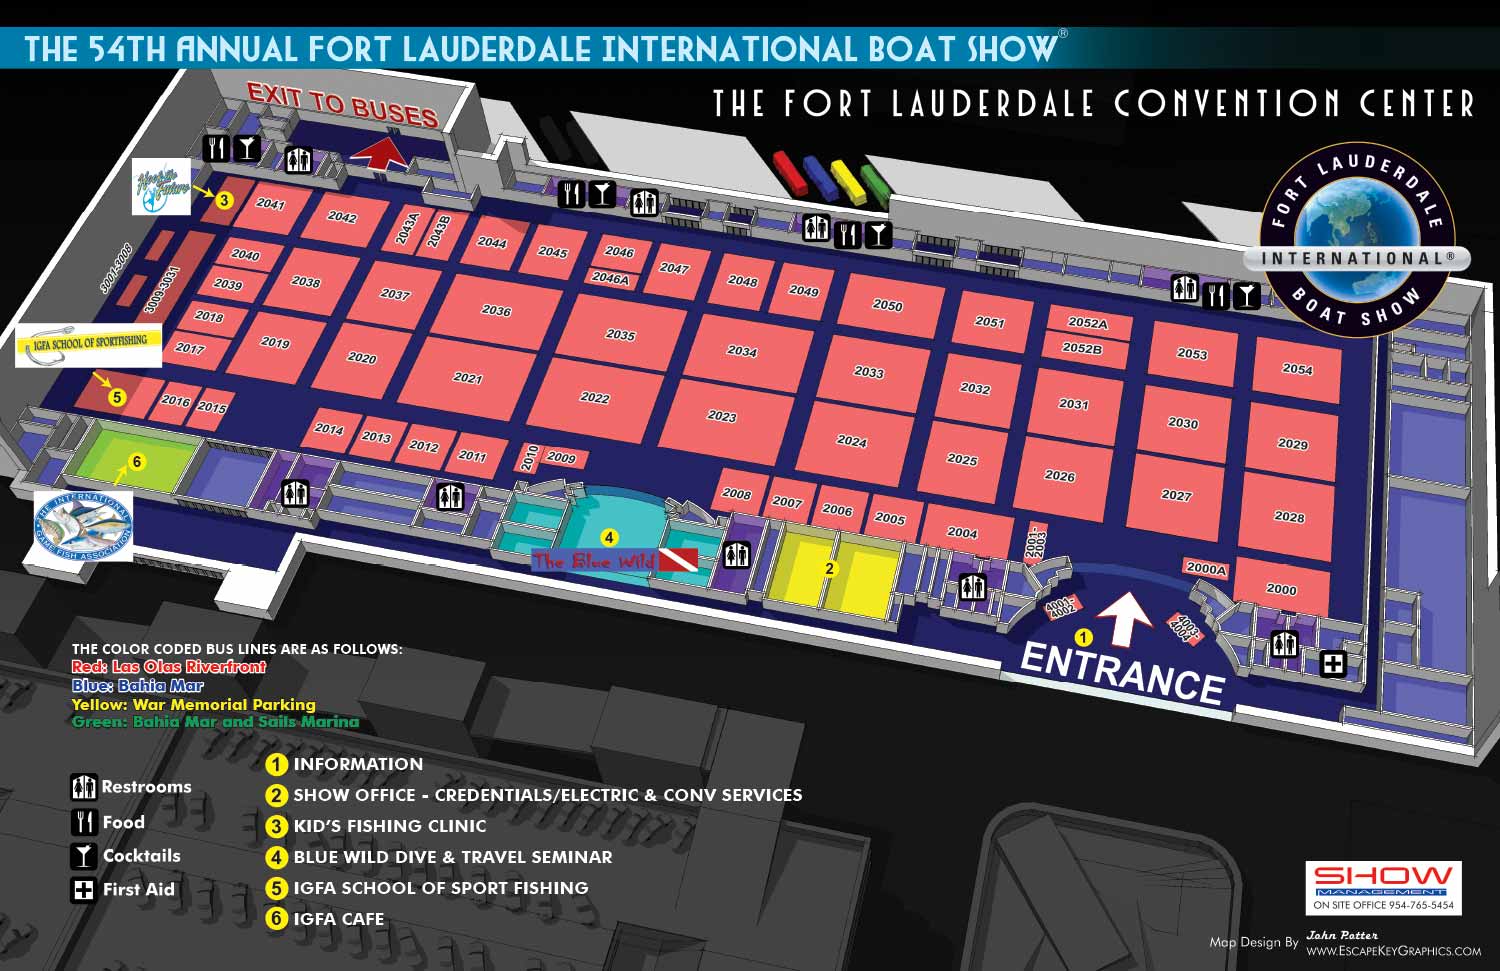
Broward County Convention Center Visitor's Map for the Fort Lauderdale International Boat Show
The 2013 Broward County Convention Center map for the Fort Lauderdale International Boat Show (FLIBS) represents a significant evolution in my illustrative approach. This year marked a major transition from the established axonometric vector style to a new methodology built upon a three dimensional digital model. This shift fundamentally improved the map's realism and versatility, providing a more natural perspective and authentic shading that better conveyed the spatial experience of the venue.
While the concept of a building cutaway was retained, the new digital workflow offered unprecedented flexibility. I was able to widen the field of view, presenting a more comprehensive overview of the interior layout than was previously possible. The functional system for indicating exhibitor spaces remained, but with an updated color scheme. The convention floor was now rendered in a dark blue, with individual exhibitor footprints appearing in a light, rusty red, maintaining clear visual differentiation for attendees.
Enhanced Detail and Expanded Scope
The map incorporated several important enhancements to better serve visitors. Prominent showcase exhibits, including the Wild Blue, IGFA School of Sportfishing, and Hook the Future areas, were now highlighted using their official logos, integrating brand recognition into the wayfinding tool. The shuttle buses outside the center were illustrated with more realistic scale and accurate positioning, improving the utility of transportation information.
A major advancement was the model's capacity to depict new areas of the show with efficiency and consistency. For the first time, the map included the outdoor exhibit space known as the Sailfish Pavilion. Because this area was built into the same comprehensive 3D model, creating a detailed exterior map view required simply rendering the model from a different angle. This efficient workflow allowed for the creation of multiple, accurate views from a single digital asset, maximizing the value of the initial modeling work.
The 2013 convention center map was one of many produced for that year's show, forming part of a cohesive navigational system. This project demonstrated how adopting advanced digital tools could elevate the precision, realism, and functional scope of illustrative cartography for a world class event.
This map is part of an ongoing annual series. To see the previous design that this map replaced, please visit the Broward Convention Center 2012 Map.
For more examples of 3D illustrative modeling and event cartography, please explore my full Map Portfolio.
Fort Lauderdale International Boat Show Maps:
- About Fort Lauderdale International Boat Show
- Bahia Mar, Swimming Hall of Fame & Las Olas Marina Maps: 2025 | 2024 | 2023 | 2022 | 2020 | 2019 | 2018 | 2017 | 2016 | 2015 | 2014 | 2013 | 2012 | 2011 | 2010
- Parking and Transportation Maps: 2025 | 2024 | 2023 | 2022 | 2020 | 2019 | 2018 | 2015 Bus | 2015 Water Taxi | 2014 | 2013 | 2012 | 2011
- Broward County Convention Center Maps: 2025 | 2024 | 2023 | 2022 | 2017 Sailfish Pavilion | 2017 | 2016 Sailfish Pavilion | 2016 | 2015 Sailfish Pavilion | 2015 | 2014 Sailfish Pavilion | 2014 | 2013 Sailfish Pavilion | 2013 | 2012 | 2011 | 2010
- Marinas Maps: 2025 | 2024 | 2023 | 2022 | 2019 | 2016
- Program Layouts: 2025 | 2024 | 2023 | 2022
- Signs: 2013 looking north | 2013 Yachting Tent
- Video: 2013 54th Annual
- Illustrations (not maps): 2014A | 2014B


