Fort Lauderdale International Boat Show Map - 2010
Client: Show Management
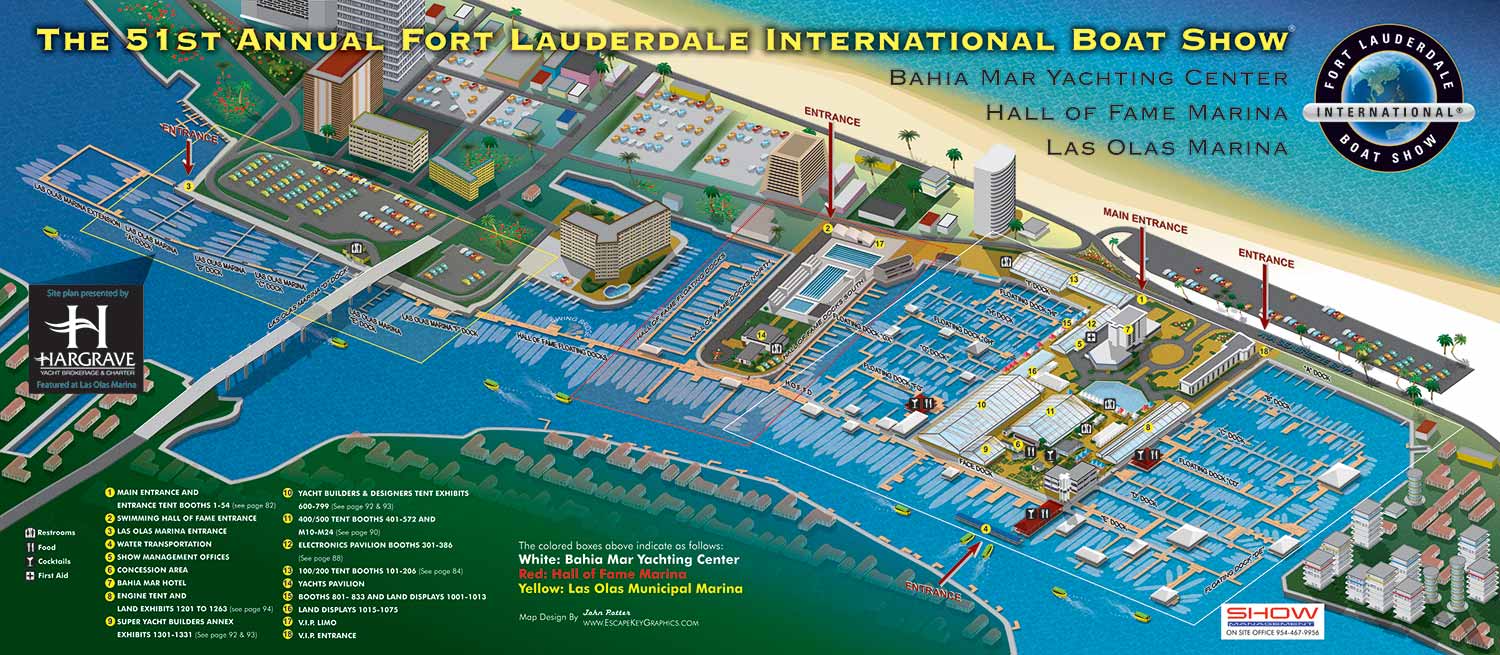
The 2010 Fort Lauderdale International Boat Show marked the beginning of my long involvement with large scale marine event mapping and represents an important moment in the evolution of illustrated boat show maps. At the time, custom made maps were rarely used for boat shows. Most shows relied on technical CAD drawings, simple diagrams, or no public facing maps at all, which often made navigation difficult for attendees. In hindsight, this project helped demonstrate the value of professionally illustrated maps for complex waterfront events, a practice that has since become standard across the industry.
This was my first boat show map, and it was completed under a demanding two week production schedule. I used an isometric, more accurately described as an axonometric, illustration approach that I had already proven effective in other mapping projects. The illustrated area extended from Bahia Mar Marina through the International Swimming Hall of Fame and into Las Olas Marina. Surrounding context such as the beach and nearby buildings was intentionally included to help visitors orient themselves within the broader environment.
Entrances were clearly marked with directional arrows, while a restrained color system was used to distinguish the major areas of Bahia Mar Marina, the International Swimming Hall of Fame, and Las Olas Marina. Docks were labeled directly by name, and major points of interest were identified through a numbered key system. Frequently used amenities were indicated with a simple, consistent set of graphical icons to support quick recognition.
Although it was not immediately apparent at the time, this project established much of the visual language and structural methodology that I would refine and apply repeatedly in the years that followed. This vector based illustration served as the foundation for updated annual editions of the map through 2013, after which I transitioned to a three dimensional digital modeling workflow that offered greater flexibility in both visual presentation and practical production needs.
Fort Lauderdale International Boat Show Maps:
- About Fort Lauderdale International Boat Show
- Bahia Mar, Swimming Hall of Fame & Las Olas Marina Maps: 2025 | 2024 | 2023 | 2022 | 2020 | 2019 | 2018 | 2017 | 2016 | 2015 | 2014 | 2013 | 2012 | 2011 | 2010
- Parking and Transportation Maps: 2025 | 2024 | 2023 | 2022 | 2020 | 2019 | 2018 | 2015 Bus | 2015 Water Taxi | 2014 | 2013 | 2012 | 2011
- Broward County Convention Center Maps: 2025 | 2024 | 2023 | 2022 | 2017 Sailfish Pavilion | 2017 | 2016 Sailfish Pavilion | 2016 | 2015 Sailfish Pavilion | 2015 | 2014 Sailfish Pavilion | 2014 | 2013 Sailfish Pavilion | 2013 | 2012 | 2011 | 2010
- Marinas Maps: 2025 | 2024 | 2023 | 2022 | 2019 | 2016
- Program Layouts: 2025 | 2024 | 2023 | 2022
- Signs: 2013 looking north | 2013 Yachting Tent
- Video: 2013 54th Annual
- Illustrations (not maps): 2014A | 2014B
Fort Lauderdale International Boat Show (FLIBS): World’s Largest Marine Event & Custom Map Design Showcase:
The Fort Lauderdale International Boat Show (FLIBS) is widely recognized as the largest in-water boat show in the world, held annually in Fort Lauderdale, Florida - often called the “Yachting Capital of the World.” Produced by Informa Markets and owned by the Marine Industries Association of South Florida (MIASF), FLIBS draws a global audience of yacht owners, buyers, industry professionals, and enthusiasts to South Florida each fall.
Spanning nearly 90 acres and more than three million square feet of exhibit space across multiple waterfront locations - including Bahia Mar Yachting Center, Las Olas Marina, Pier Sixty-Six, Hall of Fame Marina, Convention Center, and more. FLIBS features over 1,300 boats and hundreds of exhibitors from more than 50 countries.
A Global Marine Marketplace and Lifestyle Event
Each five-day show attracts more than 100,000 visitors, ranging from seasoned yacht buyers and marine professionals to aspiring boat owners and lifestyle attendees. Vessels on display span a remarkable range from sleek sport boats and performance center consoles to luxury superyachts and large world debuts making FLIBS the premier destination to experience the latest innovations in boating, marine technology, and luxury maritime living.
The 2025 show continued this legacy, showcasing a robust lineup of superyachts and high-end brokerage listings valued at nearly $2 billion, alongside new builds and debut models that underscore Fort Lauderdale’s significance in global yacht markets.
Beyond boats, the show offers immersive experiences including interactive exhibits, luxury lifestyle activations, VIP lounges, educational seminars, networking events, and opportunities to connect with top marine manufacturers, brokers, designers, and service providers.
Economic Impact and Industry Influence
FLIBS is not only a key showcase for product launches and industry trends, it’s also a powerful economic engine. Studies consistently highlight the event’s substantial impact on Florida’s economy, generating well over $1.7 billion in annual economic output, supporting tens of thousands of jobs, and driving significant tax revenue and tourism activity across the region.
Custom Map Illustration by John Potter / Escape Key Graphics
For many attendees, one of the most memorable elements of the Fort Lauderdale International Boat Show is the illustrated map system used throughout the event, helping visitors navigate the sprawling multi-location layout with confidence.
From 2010 through present (with the exception of 2021), I had the privilege of serving as the primary map illustrator and designer for FLIBS, working closely with Informa Markets (previously Show Management) to evolve the look, usability, and precision of the show’s cartographic and visual wayfinding materials. These maps have been used:
-
As the official printed show map, tailored each year to reflect expanded and redesigned show footprints
-
Within the FLIBS mobile app to help users navigate docks, tents, marinas, and exhibitor displays
-
On exhibit signage and environmental graphics throughout multiple show locations
-
As transit, guide, and foldable maps for attendee convenience
Over the years, I’ve adapted styles, software workflows, and presentation formats to improve clarity, navigability, and visual impact as the show has grown in size and complexity. My designs aim to balance technical accuracy with artistic clarity, making it easy for attendees to find exhibitors, boats, services, and key show features while reinforcing the premium brand experience of FLIBS.
Why This Matters to Marine, Luxury, and Event Clients
If you’ve enjoyed the Fort Lauderdale International Boat Show and seen these maps in action, whether printed, on signage, or in your FLIBS app, then you’ve witnessed how strategic map design and illustration can elevate a major event. Great visual wayfinding not only improves user experience but strengthens brand perception, supports marketing, and enhances audience engagement across large-scale environments.
Whether you’re planning a future show, a corporate event, or a branded experience that needs clear, compelling visual communication, custom illustration and thoughtful map design can make a meaningful difference. Visit EscapeKeyGraphics.com to explore portfolio examples and learn how custom illustration can support your next project.


BOAT SHOW MAPS ARTICLE - SOUTHERN BOATING MAGAZINE 2016:
"Navigating Miami’s multiple venues is easier when you use a map. If you’re at Yachts Miami Beach – formerly The Miami Yacht and Brokerage Show – the man behind those maps is John Potter of Escape Key Graphics, who created his first boat show map for the 201 Fort Lauderdale Int’l. Boat Show. It wasn't long before the creative concept spread. Less intimidating than site plans and more easier to follow than an aerial photography, Potter’s maps now grace the Stuart Boat Show, St. Petersburg Power & Sailboat Show in Florida and International Boat Shows like Newport, Palm Beach and Panama. His work on these shows frequently extends to many maps such as detailed area maps and transit maps. Potter’s maps can also be seen beyond the yachting industry in theme parks, resorts, wildlife sanctuaries, municipalities, campuses and gardens including Flamingo Gardens, Dinosaur World parks or The Dover International Speedway."
ADDENDUM:
I am presently responsible for illustrated maps for The Chicago International Boat Show, The Fort Lauderdale International Boat Show, The Miami International Boat Show, The Newport International Boat Show, The Newport Beach International Boat Show, The San Diego International Boat Show, The Windy City Boat & Yacht Show, The Palm Beach International Boat Show, The Suncoast Boat Show and the The Saint Petersburg Power and Sailboat Show.
There is a directory in my Boat Show Map Portfolio


WHAT ARE AXONOMETRIC AND ISOMETRIC ILLUSTRATIONS?:
Axonometric and isometric drawings don’t have realistic perspective. I use specific mathematical formulas to draw this way. In these images things further away don’t appear smaller and therefore have equal weight of importance to things nearby. My axonometric maps and illustrations are generally bold and have a slightly cartoon like look. This method of rendering perspective is commonly used in technical and engineering drawings. I began using this method of drawing as an illustration tool in 2007.
The difference between isometric and axonometric is isometric drawings are really just from a straight on corner angle but axonometric drawings can be from other angles. Most of my illustrations have parts that are isometric, but are largely axonometric. I have a habit of calling them all isometric, but I shouldn't.
PORTFOLIOS
- Illustration Portfolio: Start here for custom illustration and book covers. You can also browse illustrated maps and architectural rendering.
- Fine Art: I offer original paintings and drawings, including my Custom Halftone Series. You will also find mural work here.
- Graphic Design & Motion: View my graphic design portfolio. After that, explore motion design and animated illustrations.
- Maps by application: I create illustrated maps for boat shows, resorts, marinas, real estate, transportation, transit and parking, towns and cities, parks, and wayfinding.
- Additional project types: I also produce cover illustration, vehicle and vinyl wraps, proposal renderings, and street art.
- Illustration methods: My techniques include vector, isometric and axonometric, painting, black and white, GeoData maps, overhead maps, and custom halftones.
- Software portfolios: I work primarily in Adobe Photoshop, Adobe Illustrator, SketchUp Pro, and Adobe InDesign. For motion projects, I use Premiere Pro and After Effects.